TABLE OF CONTENTS
Monitor Build Plan Budget
The Budget tab compares what you planned, what is committed, and what actually happened. Use Current Budget for day-to-day tracking and Revisions to review every budget version.
Open the Budget tab
- Open a Build Plan (Status dashboard, Build Plans list, or Budgets Dashboard).
- Go to the Budget tab.
- Choose Current Budget (live grid) or Revisions (all budget versions).
Click Open Budget to edit the pending revision or revise the approved budget.
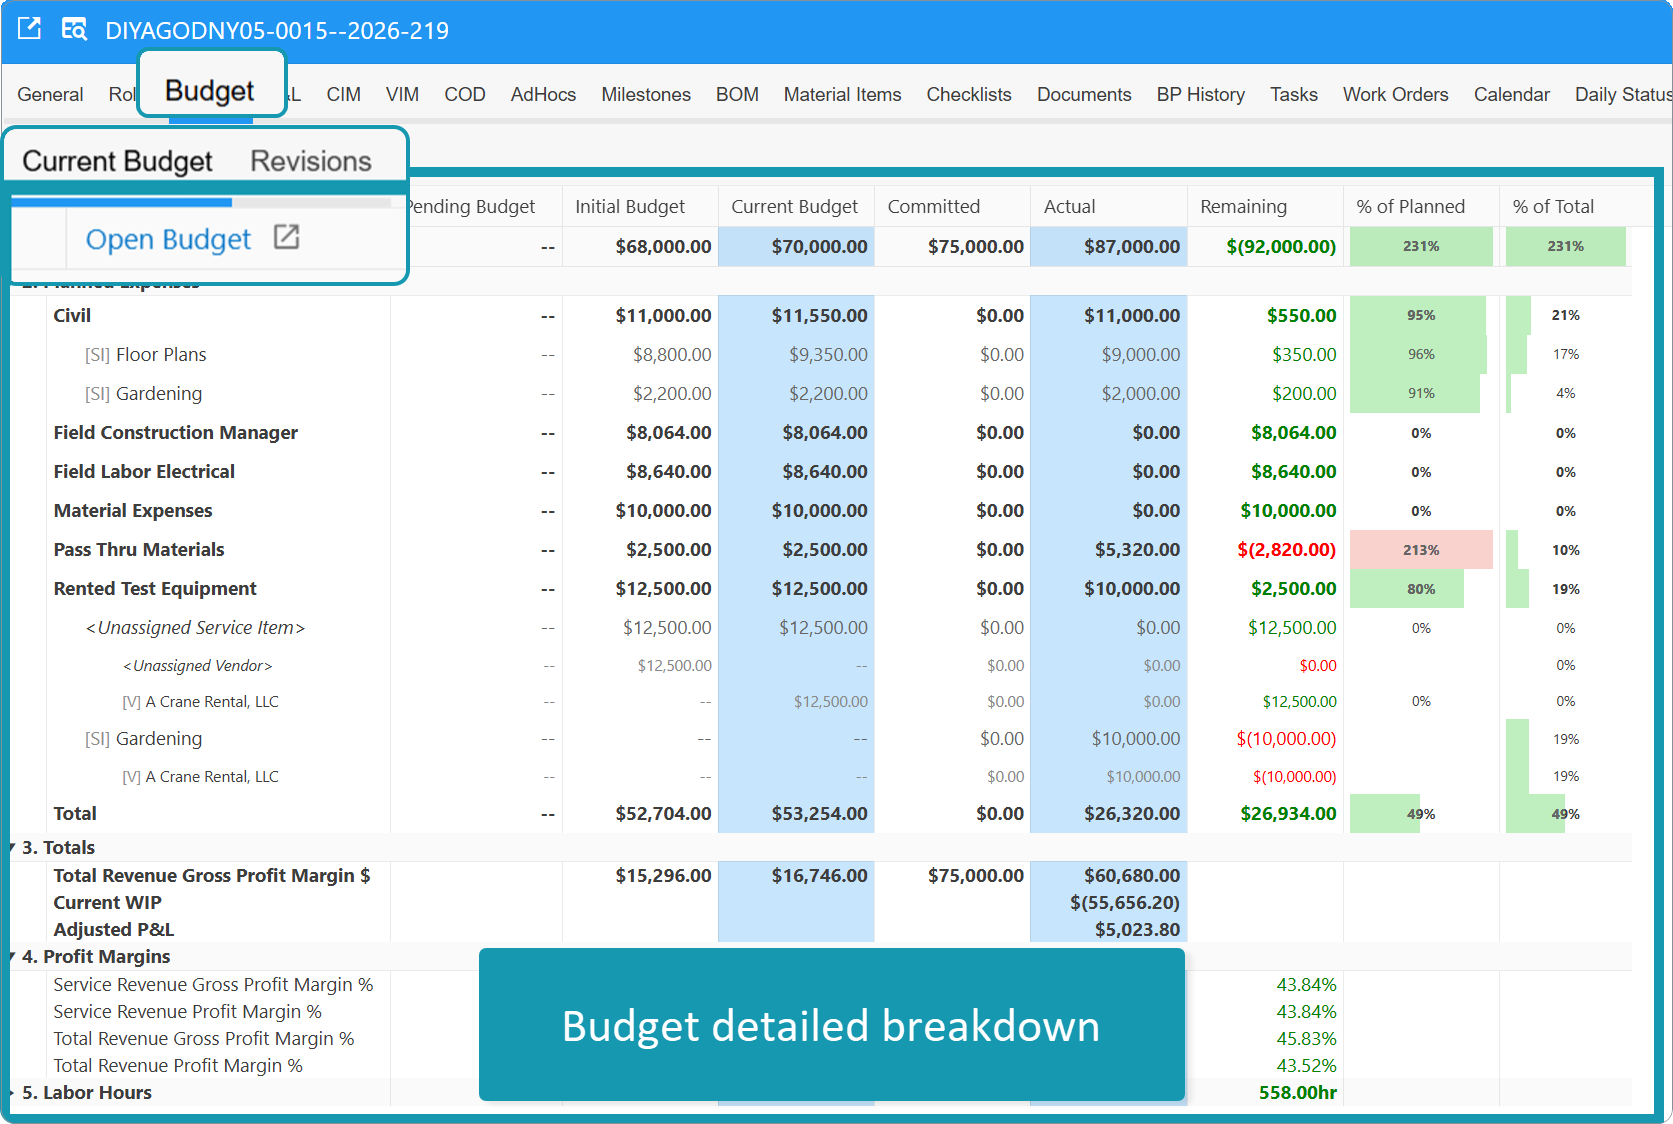
Grid columns
Same layout as the Budgets Dashboard Details view:
| Column | What it shows |
|---|---|
| Pending Budget | Single Pending revision (if one exists) |
| Initial Budget | First approved or obsolete revision () |
| Current Budget | Latest Approved revision |
| Committed | Obligated but not yet fully realized |
| Actual | Posted revenue and expenses |
| Remaining | Current Budget − (Committed + Actual) |
| % of Planned | (Committed + Actual) ÷ Current Budget |
| % of Total | Row total ÷ section total (Current Budget) |
Columns that compare against a plan — Pending Budget, Initial Budget, Current Budget, Remaining, and % of Planned — appear after you create and work with a budget.
For expenses, red usually means over budget; for revenue, red usually means under plan.
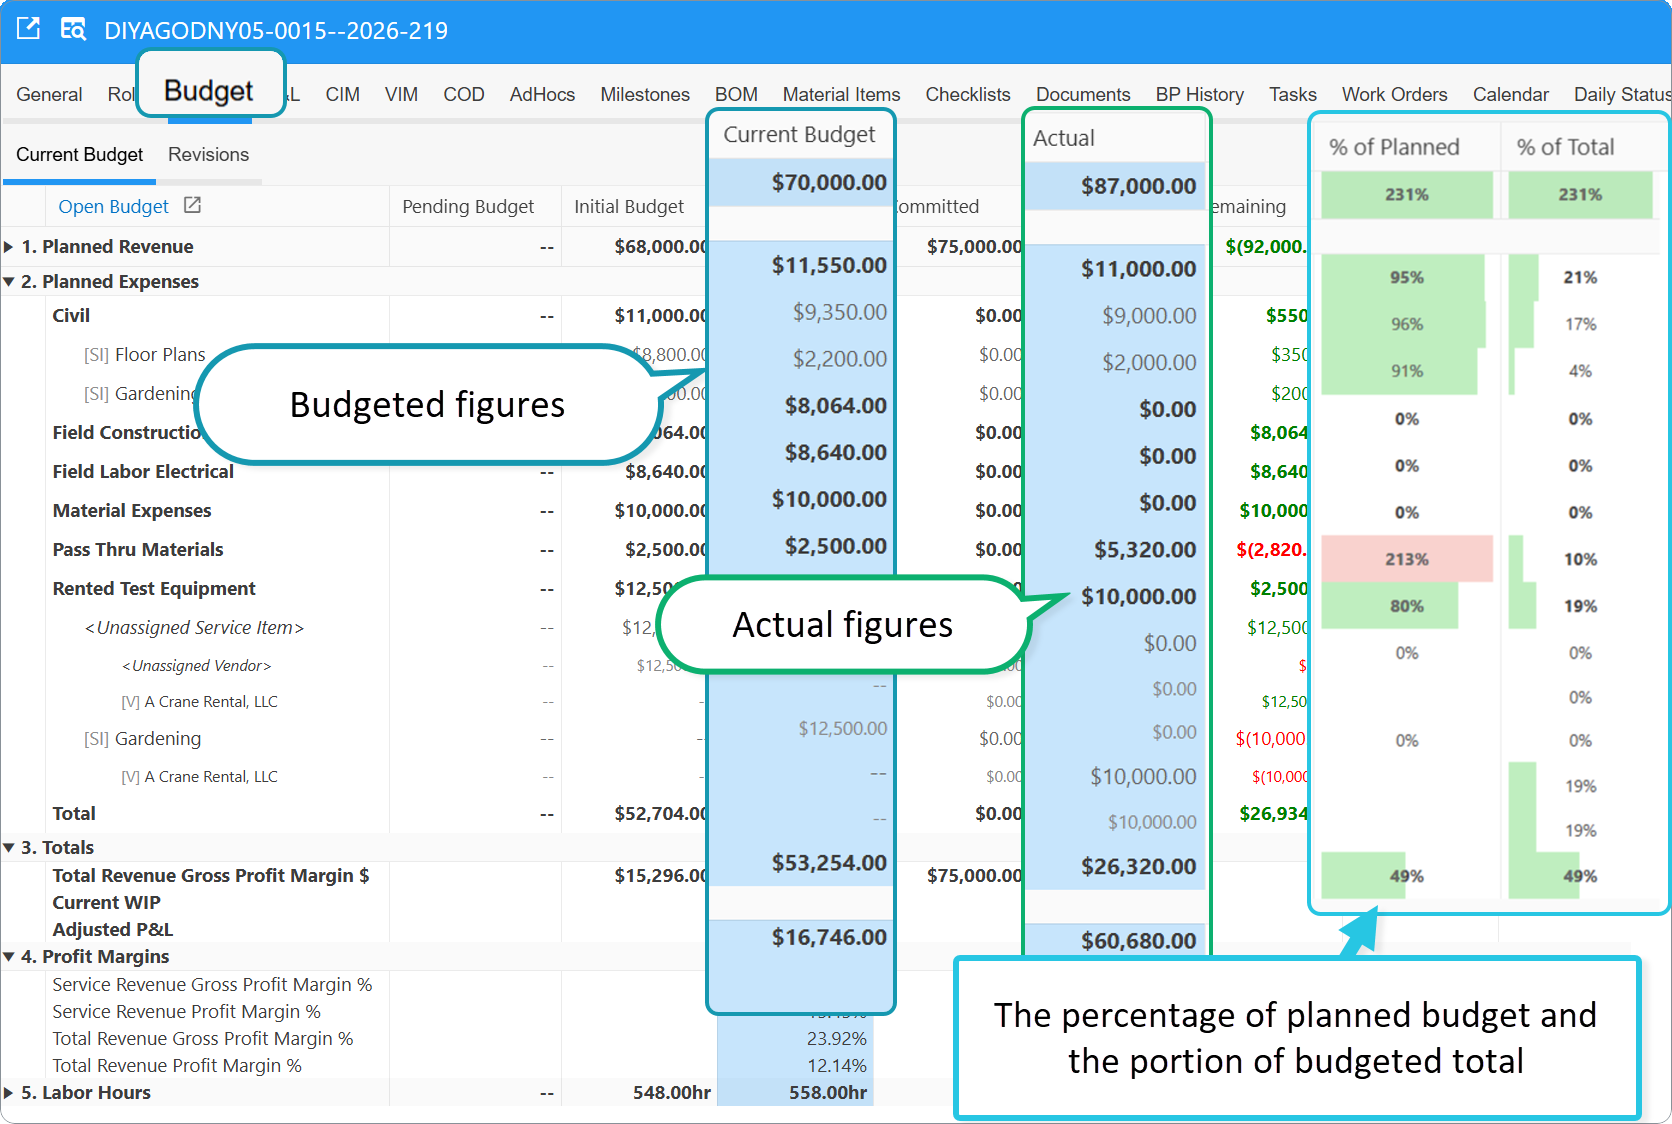
Where the numbers come from
| Column | Source |
|---|---|
| Pending | Pending budget revision line totals |
| Initial | First approved or obsolete revision |
| Current Budget | Latest approved revision (by Financial Account; optional Service Item / Vendor) |
| Committed (revenue) | Sales Order lines on customer POs, minus amounts already invoiced |
| Committed (expenses) | Open VIM PO balance + BOM in Pending or Sent to Warehouse |
| Actual (revenue) | CIM invoice financial distributions |
| Actual (expenses) | Expense FD from VIM invoices, BOM, Time Keeping, COD |
Grid sections
1. Planned Revenue
Planned revenue by financial account.
Configurable (your instance)
[SI] sub-rows appear only when revenue transactions (actual) use Service Item.
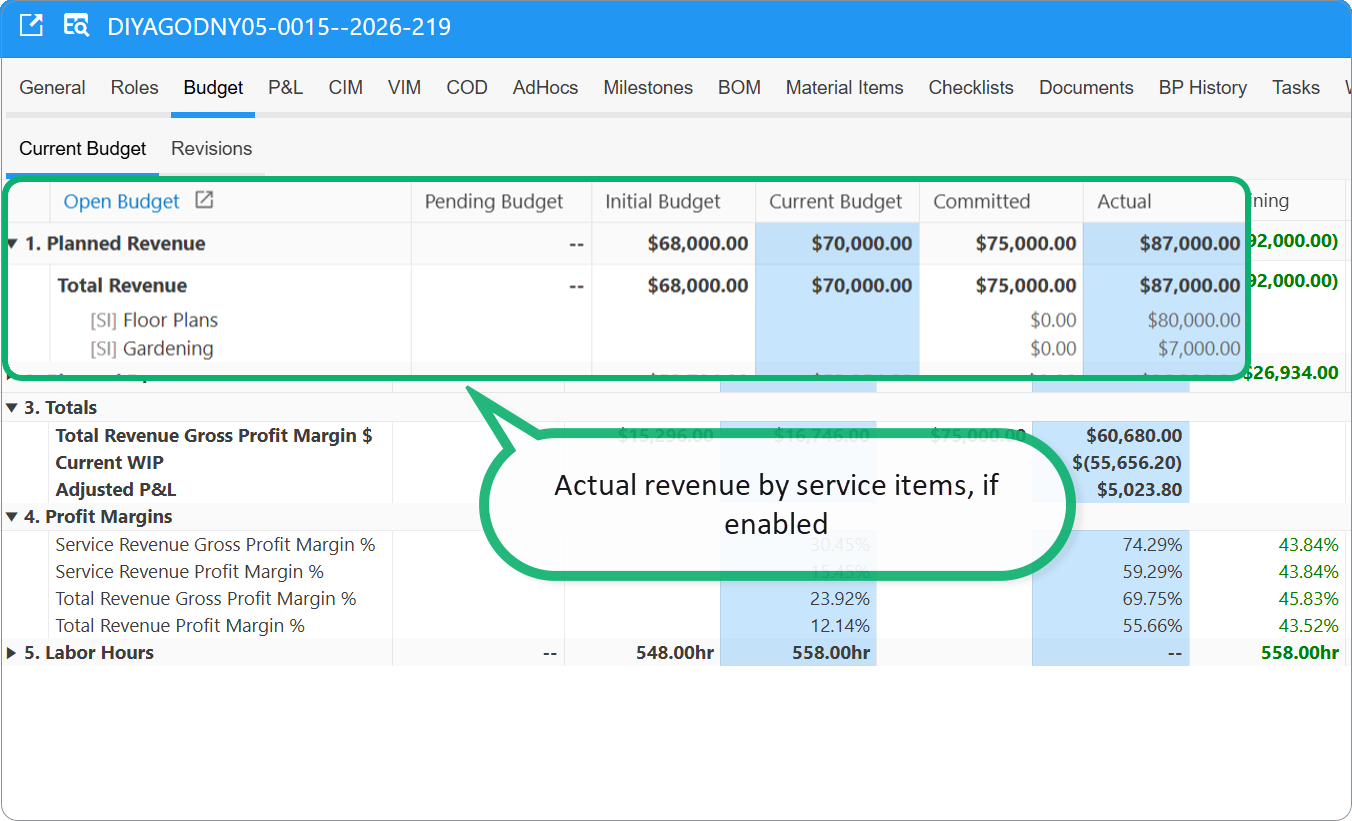
Configurable (your instance)
With UseEasyBudget, this section is labeled 1. Labor Cost ($) instead of 1. Planned Revenue.
2. Planned Expenses
Expenses by Financial Account. Rows may expand to [SI] (Service Item) or [V] (Vendor). Unassigned costs show as <Unassigned Service Item> or <Unassigned Vendor>.
Configurable (your instance)
[SI] / [V] sub-rows appear only when budget lines or transactions use Service Item or Vendor. Pass-through accounts feed Pass Thru COGS in margin rows when pass-through tracking is enabled.
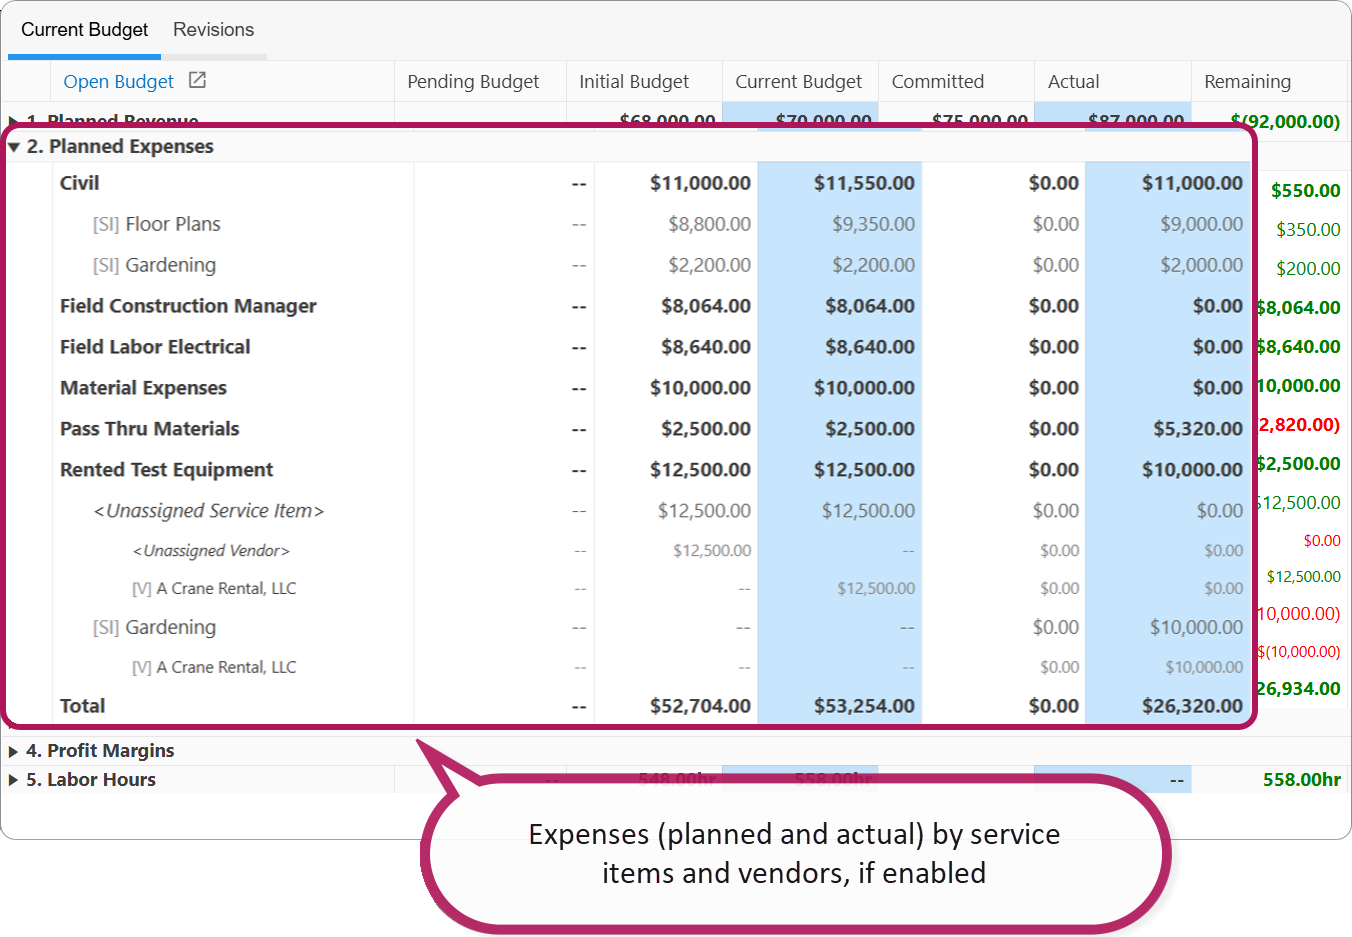
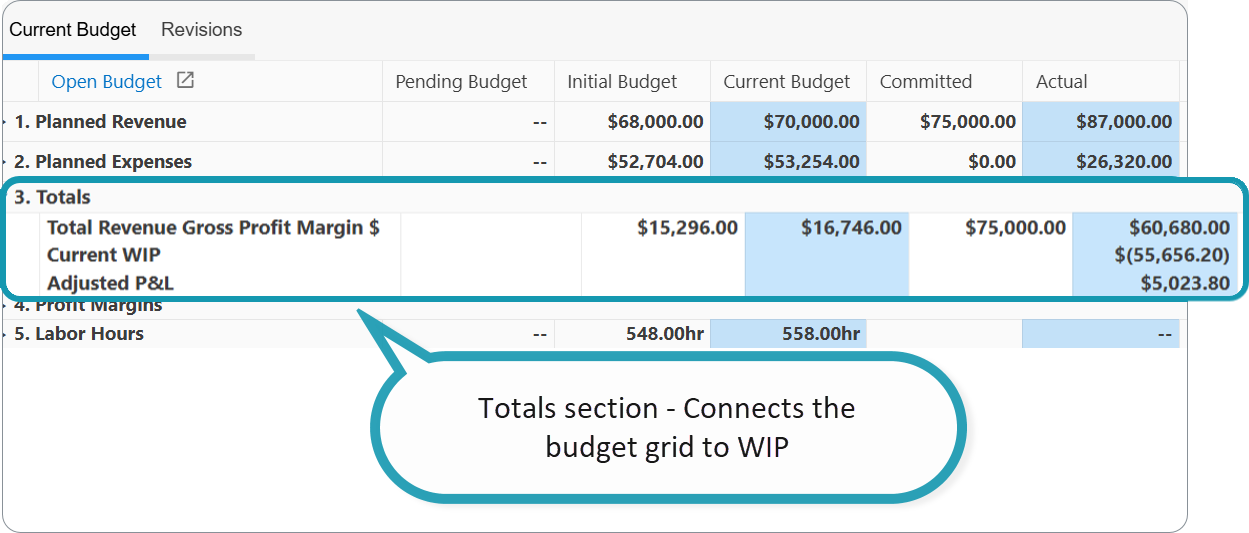
3. Totals
Connects the budget grid to WIP:
| Row | Formula |
|---|---|
| Total Revenue Gross Profit Margin | Planned Revenue − total planned expenses |
| Current WIP | Variance Under Spend − Variance Under Billed |
| Adjusted P&L | Total Revenue Gross Profit Margin − Current WIP |
Current WIP uses the same logic as WIP Report:
- Variance Under Spend = Actual spend − (Planned spend × completion %)
- Variance Under Billed = CIM invoiced revenue − (Planned Revenue × completion %)
Completion % comes from Build Plan progress (EC %), unless WIP settings use % Spent.
Configurable (your instance)
BPPercantageCalc and WIPPercentageforBPsWithoutBudget control completion % and WIP for Build Plans without a budget. See WIP Report.
No approved budget: Current WIP may useActual Spend + (Actual Spend × WIP %) − Actual Revenue.
4. Profit Margins
Compares planned % (Current Budget) vs realized % (Actual). Remaining = Actual % − Current Budget % (not dollars).
With pass-through enabled, four rows appear; with Disable Pass Through, only Total Revenue rows are shown. See Pass Through Setting.
| Row | Current Budget | Actual |
|---|---|---|
| Service Revenue Gross Profit Margin % | From budget card Summary (Gross Profit Margin $ ÷ Service Revenue $) | (1 − Direct Cost COGS ÷ Service Revenue) × 100 |
| Service Revenue Profit Margin % | From budget card Summary (Profit Margin $ ÷ Service Revenue $) | (1 − (Direct Cost COGS + Overhead) ÷ Service Revenue) × 100 |
| Total Revenue Gross Profit Margin % | From budget card Summary | (1 − (Direct + Pass Thru COGS) ÷ Actual Revenue) × 100 |
| Total Revenue Profit Margin % | From budget card Summary | (1 − (Direct + Pass Thru COGS + Overhead) ÷ Actual Revenue) × 100 |
Current Budget — percentages stored on the approved budget (same as budget card Summary).
Actual — recalculated from CIM invoice revenue and expense FD (direct vs pass-through split). Not from Planned Revenue / Planned Expenses totals in sections 1–2. Overhead % on Actual rows comes from the approved budget Overhead Type (Calculation Specification).
Service Revenue = total revenue − pass-through costs. Use it as the base for Service margin rows, not total revenue.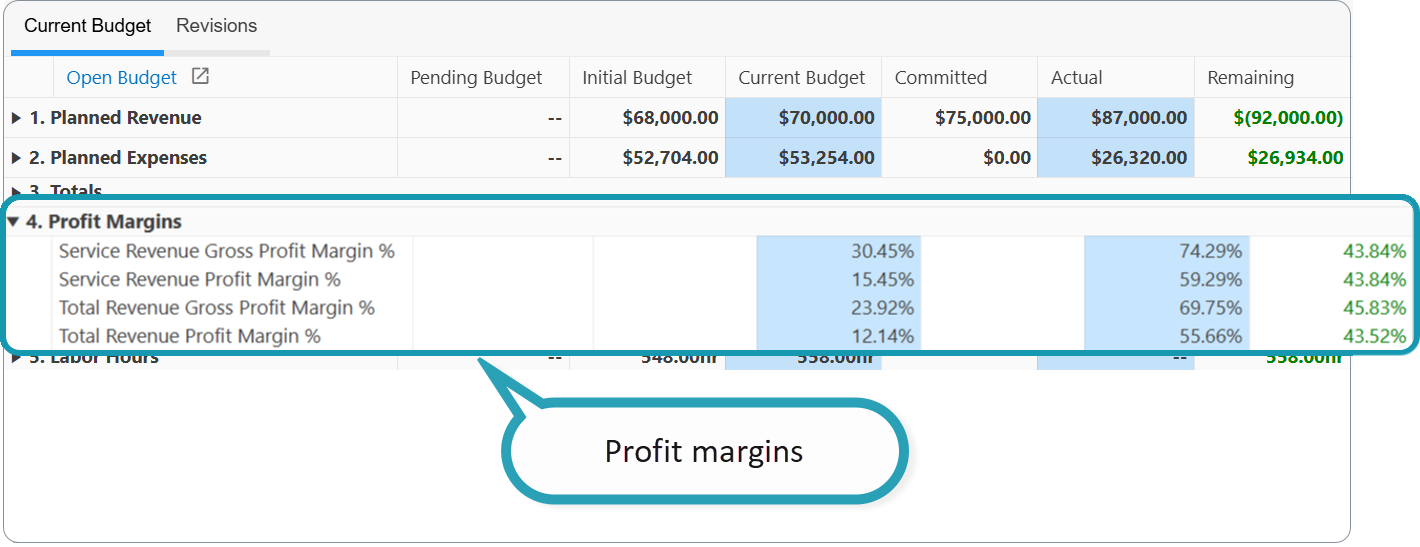
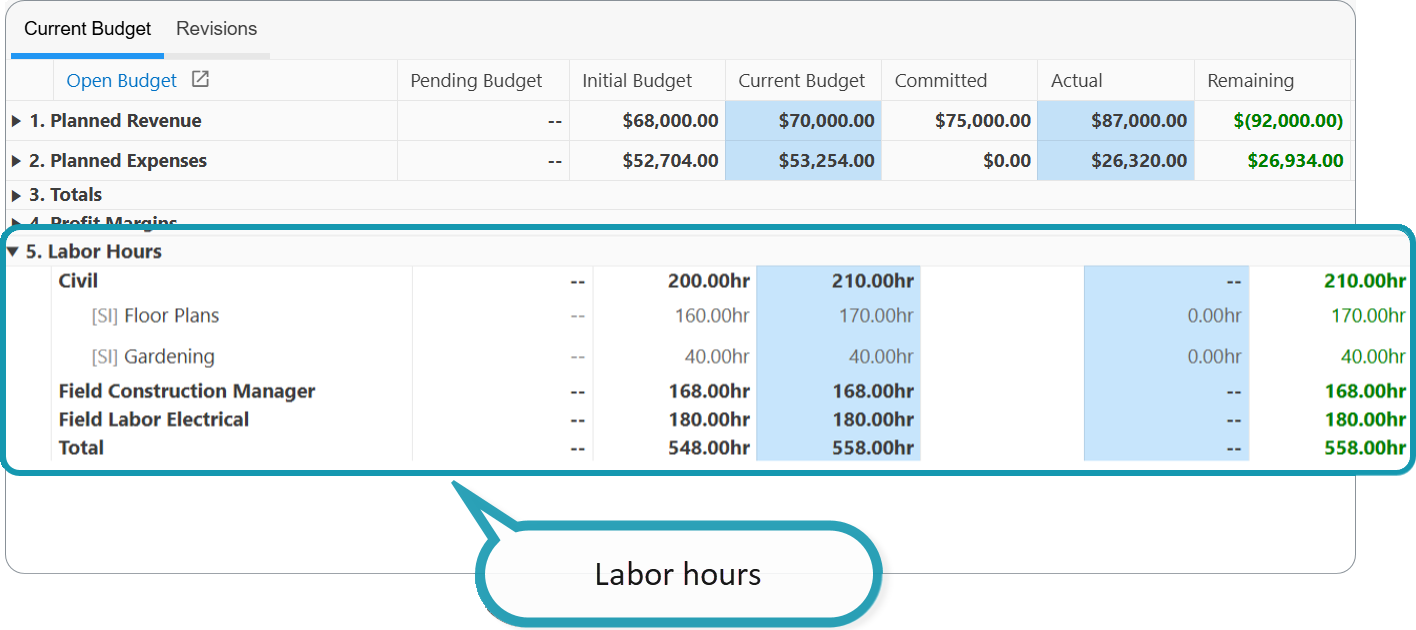
5. Labor Hours
| Column | Source |
|---|---|
| Pending / Current Budget | Labor hours on budget lines |
| Actual | Time Keeping financial distributions |
Revisions sub-tab
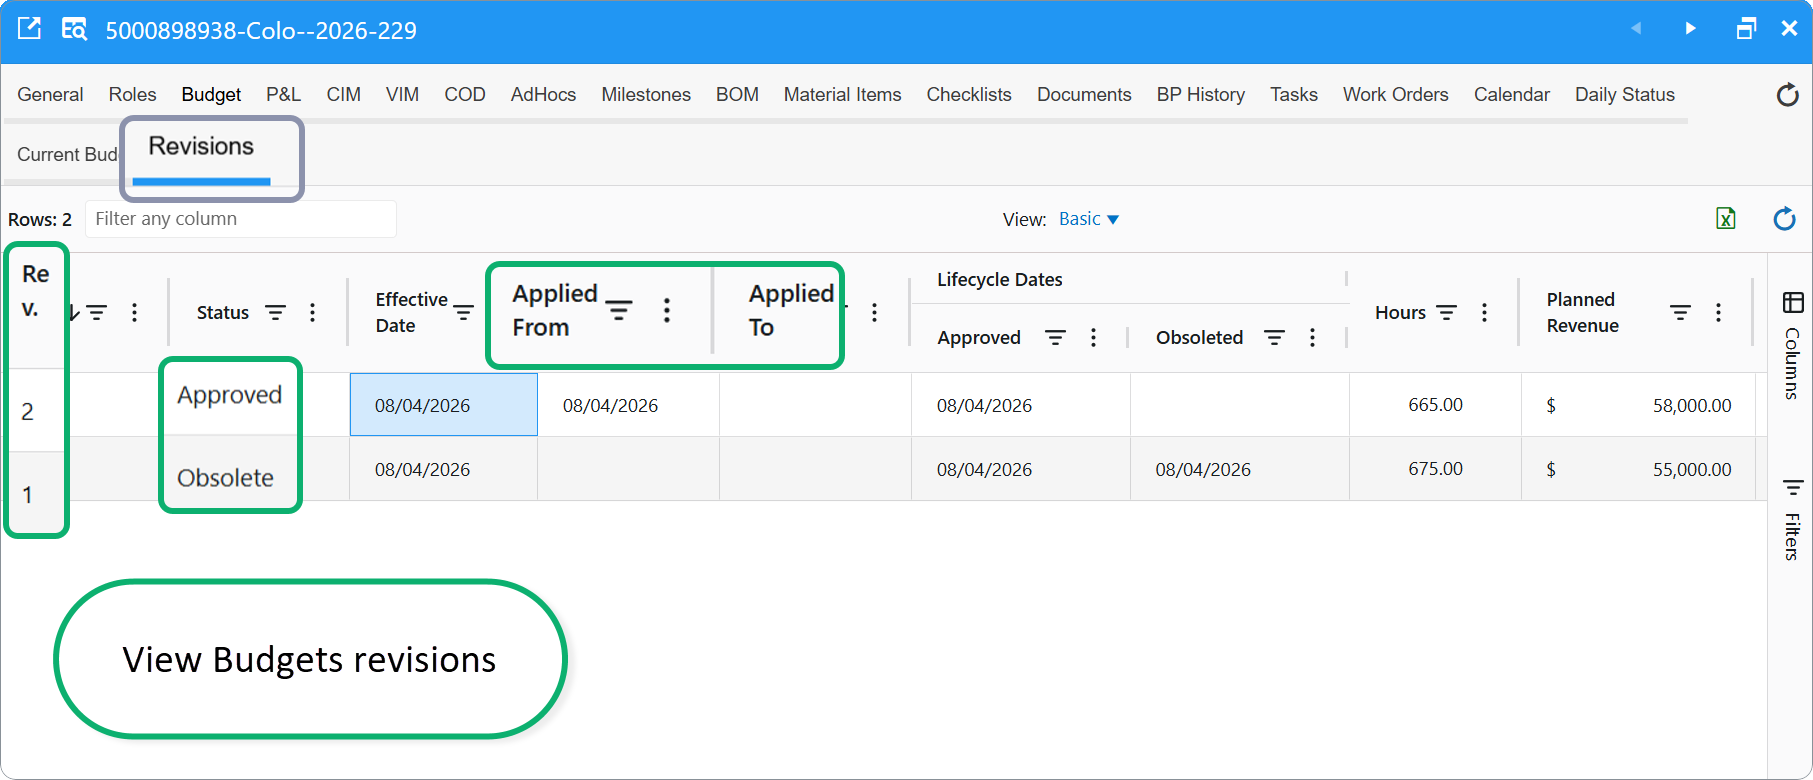
Lists every budget version: Rev No., Status, dates (Created, Submitted, Approved, Effective, Applied From / To), Hours, Planned Revenue, COGS, and margins. Use it to compare revisions without opening each card.
Q&A
Q: Why do I see [SI] and [V] rows under one financial account?
A: Costs on that account are split by Service Item or Vendor on budget lines or transactions.
Q: What does Remaining mean when it is negative and red?
A: For expenses, committed plus actual exceed the current budget. For revenue, you billed less than planned.
Q: Why is Committed high but Actual still low?
A: Open purchase orders or BOM commitments reserve budget, but vendor invoices have not been posted yet—or BOMs are still in Pending / Sent to Warehouse.
Q: How do I verify profit margin % on a calculator?
A: Current Budget % — use the approved budget card Summary. Actual % — use CIM revenue and expense FD (split direct vs pass-through); do not use section 1–2 grid totals.
Q: Does Pending Budget affect WIP?
A: No. WIP and Adjusted P&L use the Approved current budget. Pending amounts appear only in the Pending column.
Q: Can I export this grid?
A: Use Excel export on the Budgets Dashboard Details tab or on the budget card lines.
Q: Why do I only see Committed and Actual on the Budget tab?
A: This Build Plan has no budget revision yet. Create a budget to unlock planned columns (Current Budget, Remaining, and so on) and the Revisions list.
Related articles
Was this article helpful?
That’s Great!
Thank you for your feedback
Sorry! We couldn't be helpful
Thank you for your feedback
Feedback sent
We appreciate your effort and will try to fix the article