TABLE OF CONTENTS
- What is the Build Plans Dashboard
- Dashboard Visibility & Build Plan Access
- Refine Results (server-side filters)
- Working with the grid
- Editing data in the grid
- Visual Alerts & Highlighting
- Opening records and navigation
- Activating and closing Build Plans
- Creating Build Plan, Exporting, and Reloading
- Dashboard Workflows
- FAQ
What is the Build Plans Dashboard
The Build Plans (BPs) dashboard summarizes operational and financial activity for Build Plans. It shows progress, key milestones, and financial status. Data loads into an AG Grid table with pivoting, grouping, saved views, and export options.
What You See at a Glance
Each row is one Build Plan. The grid can show:
| Area | What does it tell you |
| Identity & location | Name, number, state (Active/Closed), project, scenario, region, market, customer, carrier, site, owner, dates (generated, started, closed) |
| Operational status | Permit status and comments, construction (CX) status and comments, estimated completion, days on site, days since last activity |
| Milestones | Per-milestone projected and actual dates, responsible person, comments |
| BP roles | Dynamic columns for each project role assigned on the Build Plan |
| Financial & BOM | Sales orders, budget, spend, invoicing, WIP, cashflow, BOM totals—only if your account can see financial data for at least one row |
| Calculated indicators | Flags such as “budget not approved,” “spend exceeds budget,” “COP approved ready to close,” and pipeline-style CX/COP stages |
| Actions | Activate or close a single Build Plan from the row |
Dashboard Visibility & Build Plan Access
From the main navigation, open Build Plans (under Status in the standard menu).
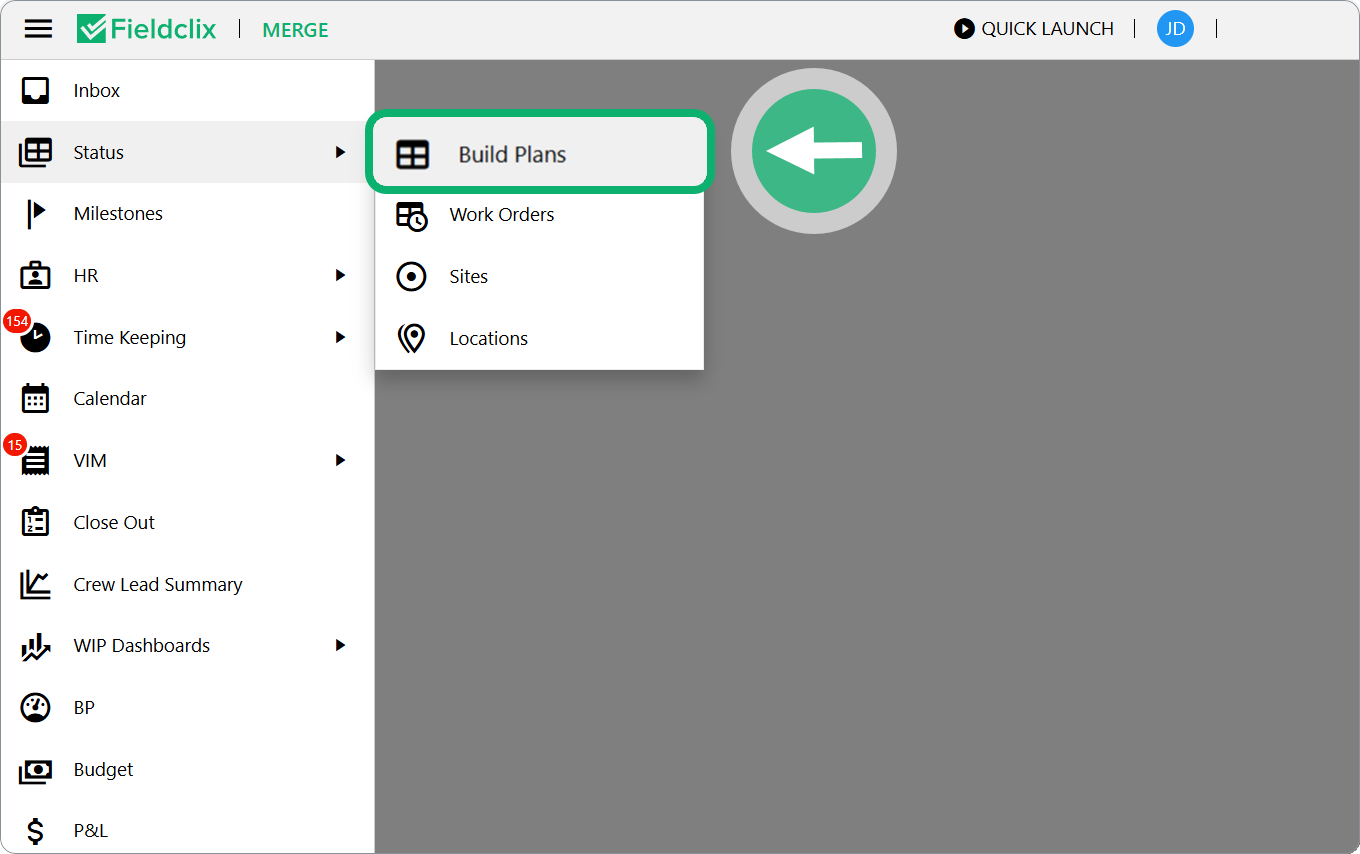
Dashboard Access Requirements: Available to all system users via the default All Users group.
- Build Plan Visibility Criteria: Users can view a Build Plan (BP) if they match any of the following criteria:
- Assigned as the BP Owner or Project Owner.
- Registered as a member of a Project Role.
- Authorized as an employee allowed to allocate time or actively dispatched to the BP.
- Global View Permissions: The Field Manager - All Direct Cost BPs employee role grants visibility into all non-overhead Build Plans grid-wide.
Financial Data Access Levels
Viewing financial metrics requires the Financial role. Once assigned, data visibility is restricted by the user's relationship to the Build Plan:
| User Role / Relationship | Financial Access Level |
| Build Plan Owner | Full financial data for owned BPs only. |
| Project Owner | Full financial data for all BPs within assigned projects. |
| Project Role(with "financial access rights" enabled) | Financial data restricted to BPs where the user actively participates. |
| Employee Role: All Direct Cost BPs Financials | Global financial data for all direct-cost BPs. |
| Employee Role: All Direct Cost BPs Financials | Unrestricted financial data access (includes direct-cost and overhead BPs). |
ℹ️ Operational View Fallback: Users without financial permissions can still view all operational columns, including project details, sites, milestones, assigned roles, and permit/CX statuses.
Refine Results (server-side filters)
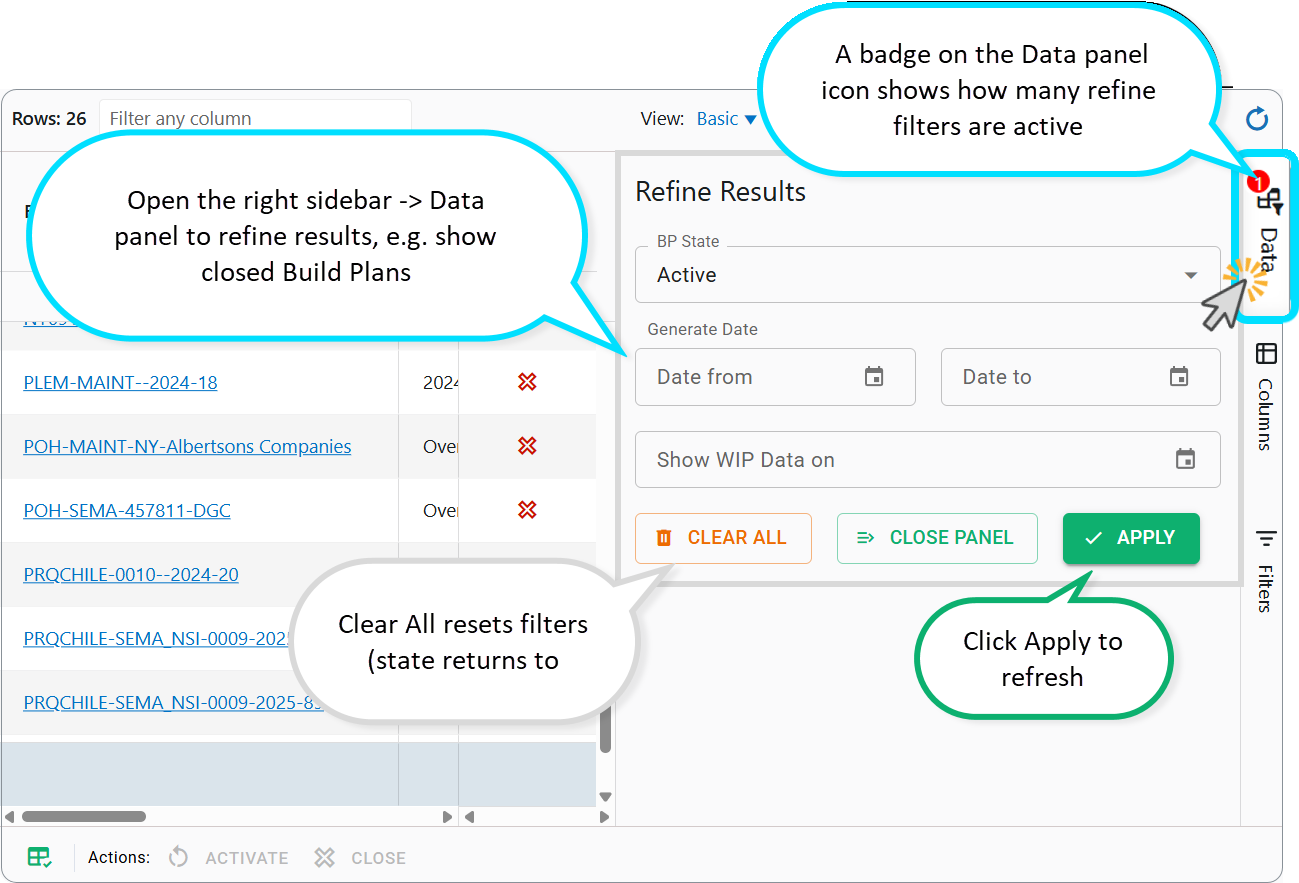
The default view shows active Build Plans only. Use Refine Results to display closed Build Plans.
Open the right sidebar → Data panel (“Refine Results”). These filters reload data from the server.
- BP State — Active / Closed / All
- Generate Date — Range on Build Plan generation date
- Show WIP Data on — Date used for WIP calculations
Click Apply to refresh. Clear All resets filters (state returns to Active). A badge on the Data panel icon shows how many refine filters are active.
Working with the grid
- Sort: Click header for single; Shift + click for multi-column.
- Filter: Use header inputs or sidebar Filters panel. Clear via status bar (leaves Refine Results intact).
- Search: Use "Filter any column" in the status bar.
- Layout: Use sidebar Columns panel to hide, show, or pin fields.
- Pivot: Turn on grouping/pivoting via sidebar. Owner Stats view automatically pivots by Build Plan Owner.
- Totals & Counts: Bottom row shows grand totals; status bar shows selected cell metrics and active row counts.
Saved views
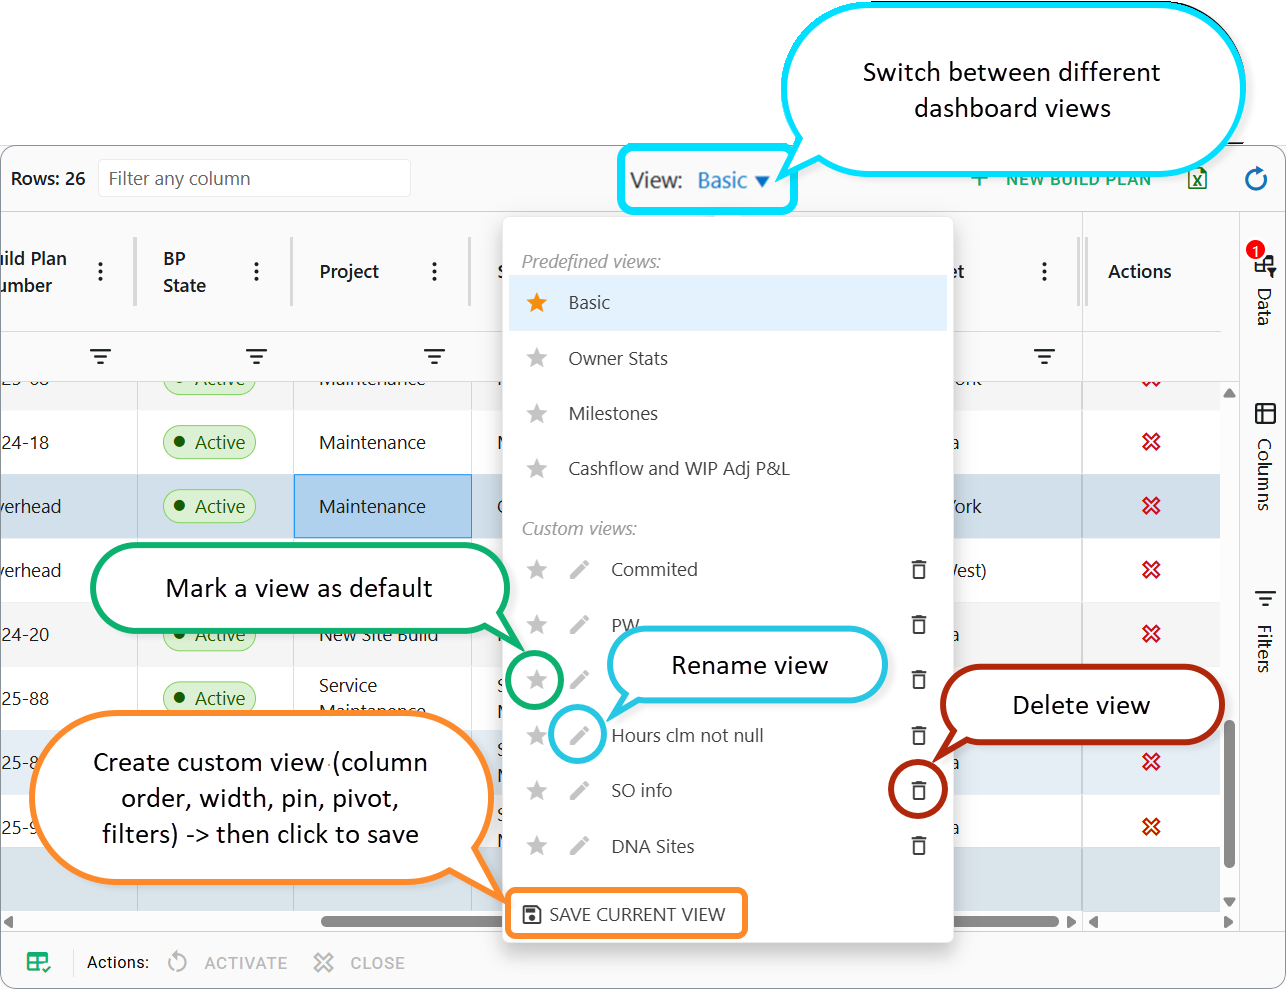
The Views control in the status bar switches layouts. Built-in views:
| View | Focus |
| Basic | Identity, project hierarchy, site, owner, key dates |
| Milestones | Permit/CX status + milestone projected/actual/responsible/comments (active milestones only) |
| Owner Stats | Pivot by Build Plan Owner with calculated risk flags (financial access only) |
| Cashflow and WIP Adj P&L | Remaining invoice/spend/cashflow, spend breakdown, WIP, P&L (financial access only) |
You can save custom views (column order, width, pin, pivot, filters). Mark a view as default; rename or delete saved views.
Predefined views may ship with a filter model (e.g. active-only, budget approved in Cashflow view).
Editing data in the grid
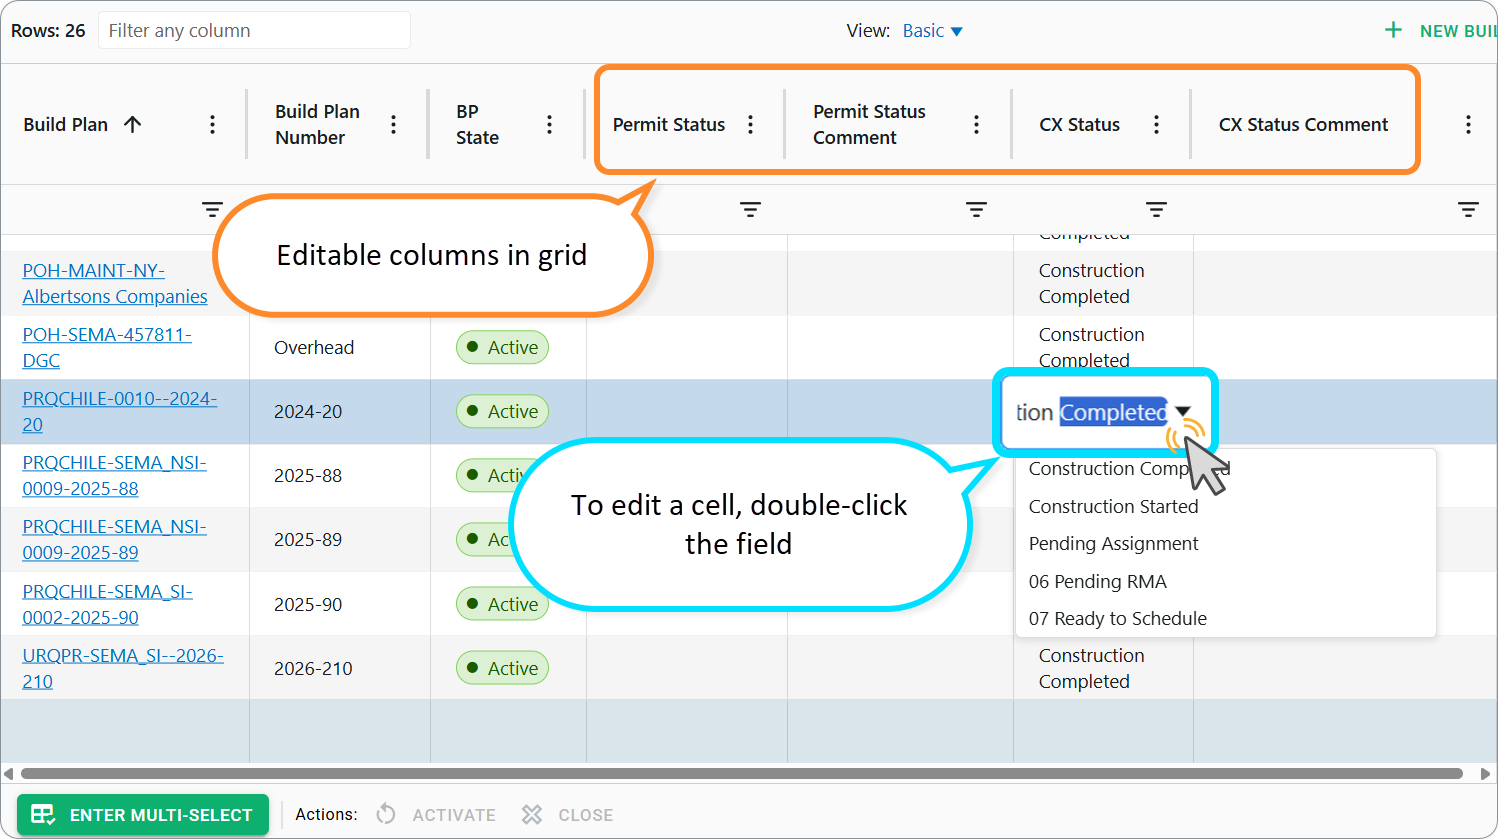
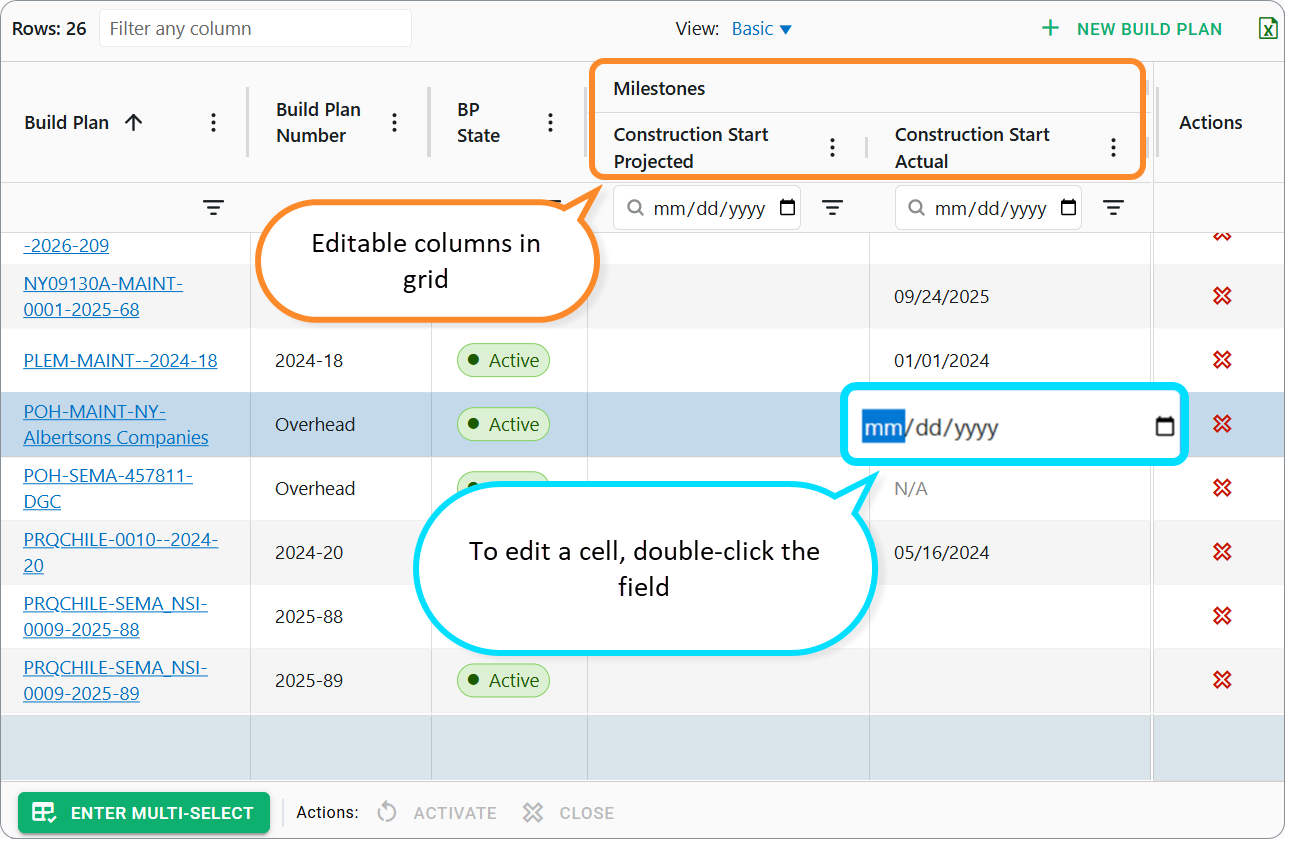
To edit a cell, double-click the field. Any changes you make are saved immediately to the server.
Statuses
- Permit: View and edit permit statuses and comments.
- CX (Construction): View and edit construction statuses and comments.
Managing Milestones
Milestones only appear if they apply to your specific Business Partner (BP) scenario. For applicable milestones, you can manage:
- Dates: Input and track both projected and actual dates.
- Responsibility: Assign an employee from the dropdown list (includes a "Not Assigned" option).
- Comments: Add specific notes to the milestone.
Note: Milestone cells that do not apply to your current scenario are visually disabled and cannot be edited.
Visual Alerts & Highlighting
Date highlighting
- Projected Dates: Highlighted in red if they are overdue relative to the actual completion dates.
- Actual Dates: Highlighted if they lag behind the original projected expectations.
Financial alerts
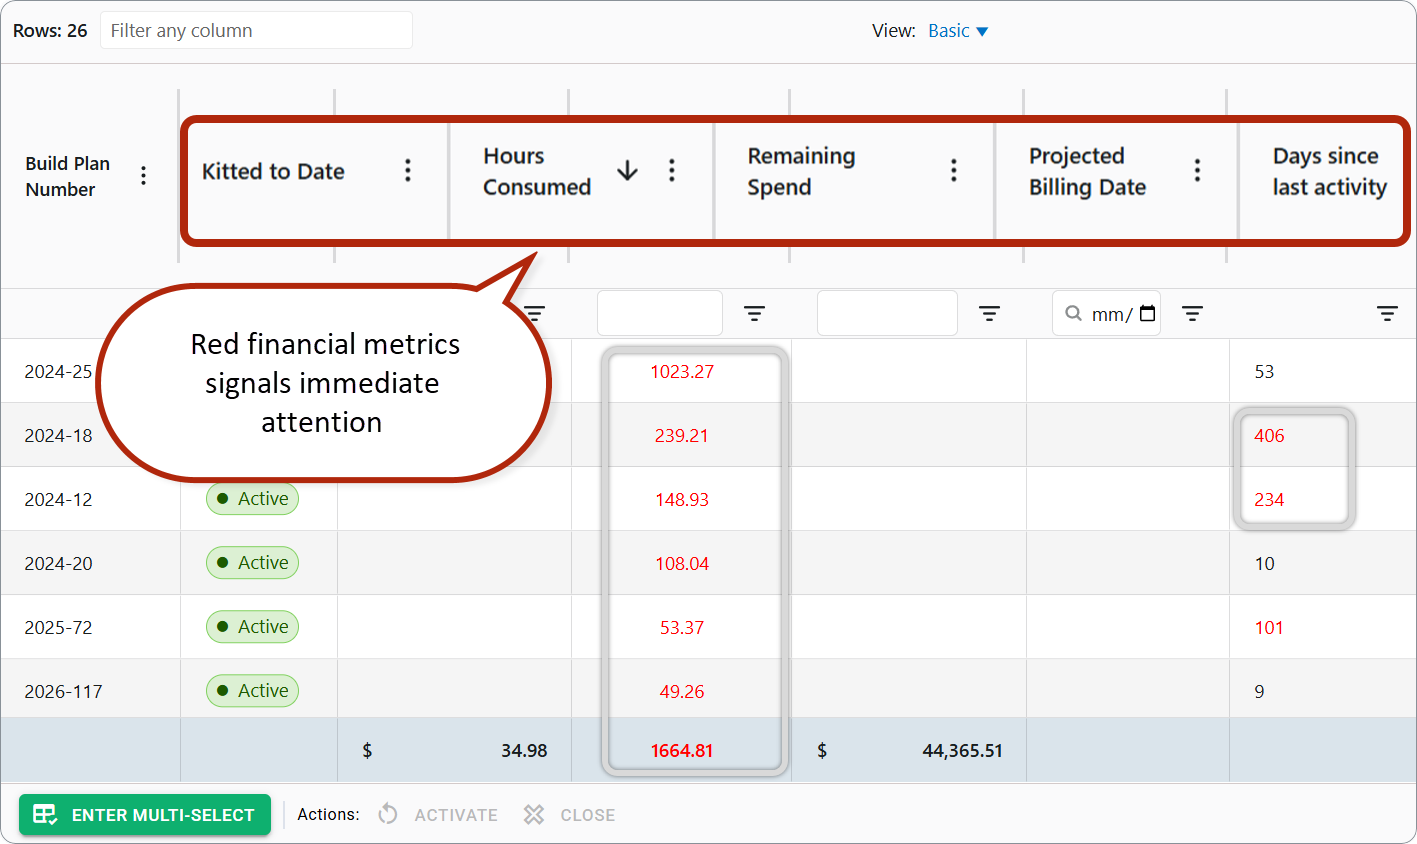
The following critical financial metrics will turn red to signal immediate attention:
- Remaining Spend: Negative remaining spend
- Hours consumed: Hours over budget
- Kitted to Date: Kitted Bill of Materials (BOM) exceeding the BOM total
- Project Billing Date: Projected billing that is overdue with an remaining balance left to invoice
- Days since last activity: Build Plans with 60+ days of inactivity
Opening records and navigation
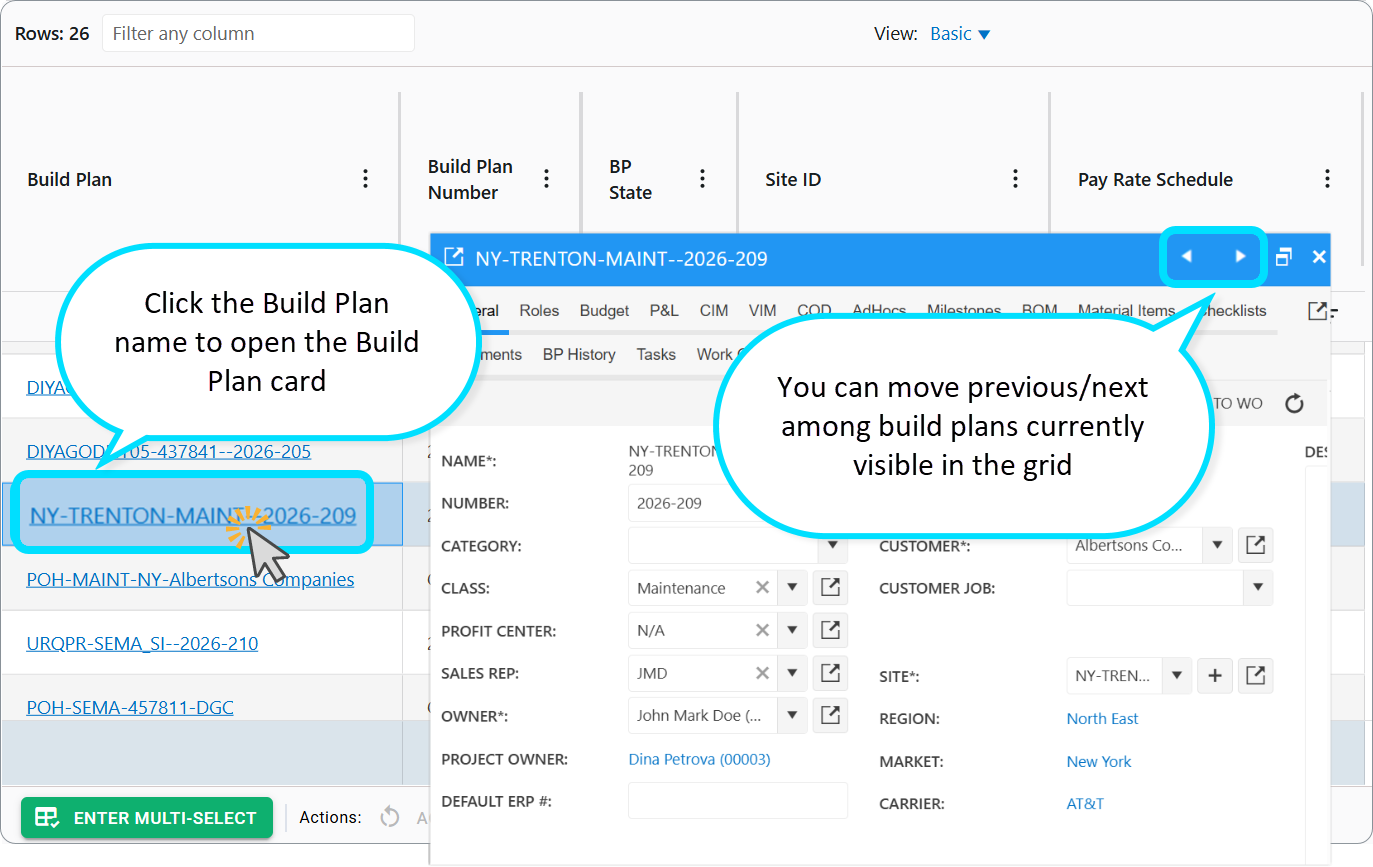
- Click the Build Plan name to open the Build Plan card. You can move previous/next among build plans currently visible in the grid.
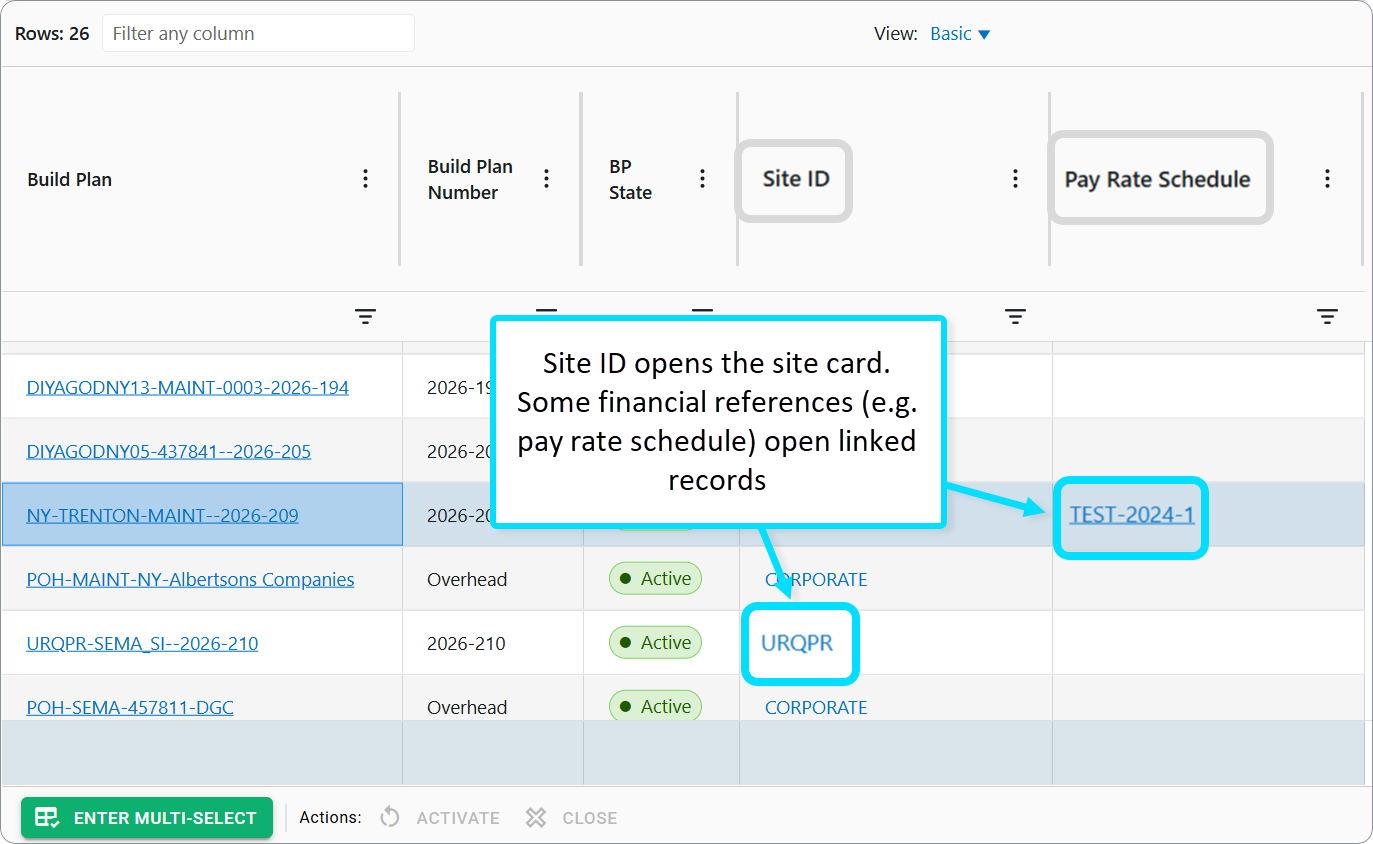
- Site ID opens the site card.
- Some financial references (e.g. pay rate schedule) open linked records.
Activating and closing Build Plans
Updating a Single Build Plan
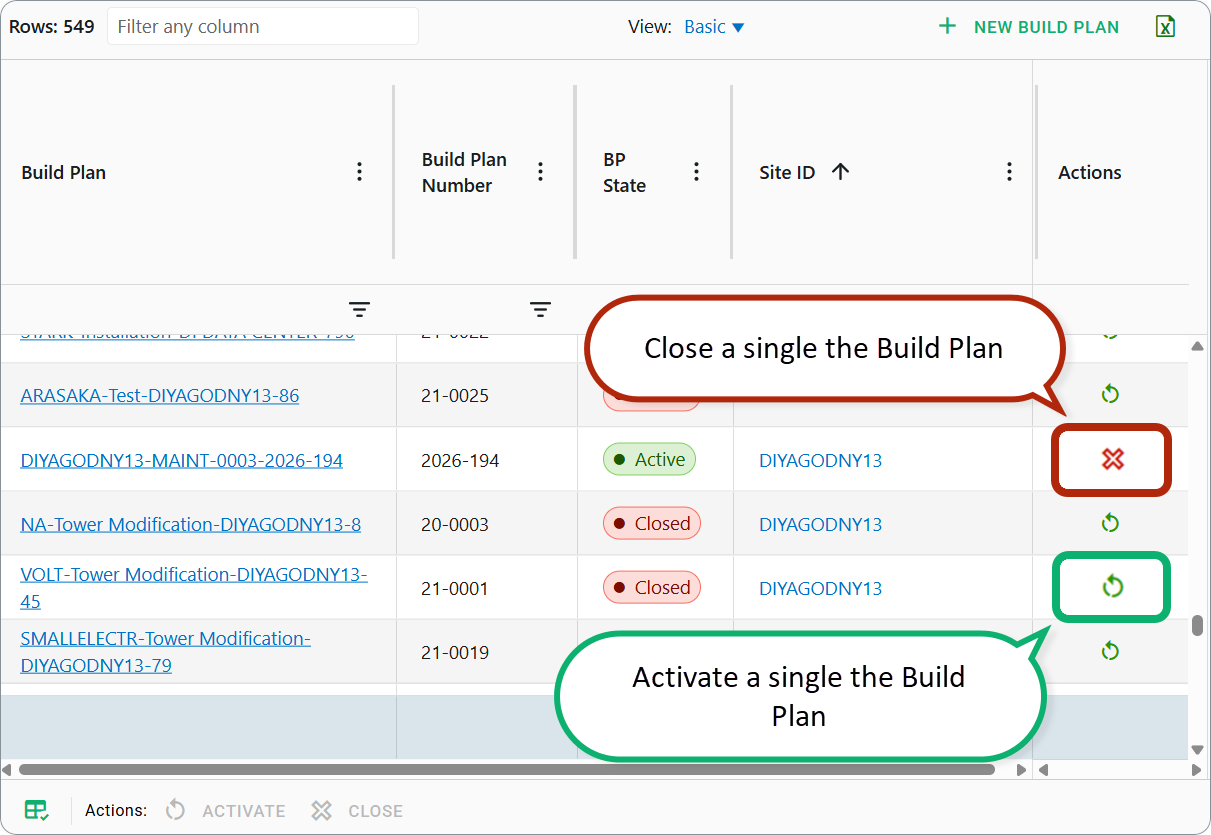
To update an individual Build Plan, locate the Actions column (pinned to the far right of the grid):
- Activate: Changes a plan's status from Closed to Active.
- Close: Changes a plan's status from Active to Closed.
Confirmation Required: Every status change will prompt a confirmation dialog before applying the update.
Bulk Updating Multiple Build Plans
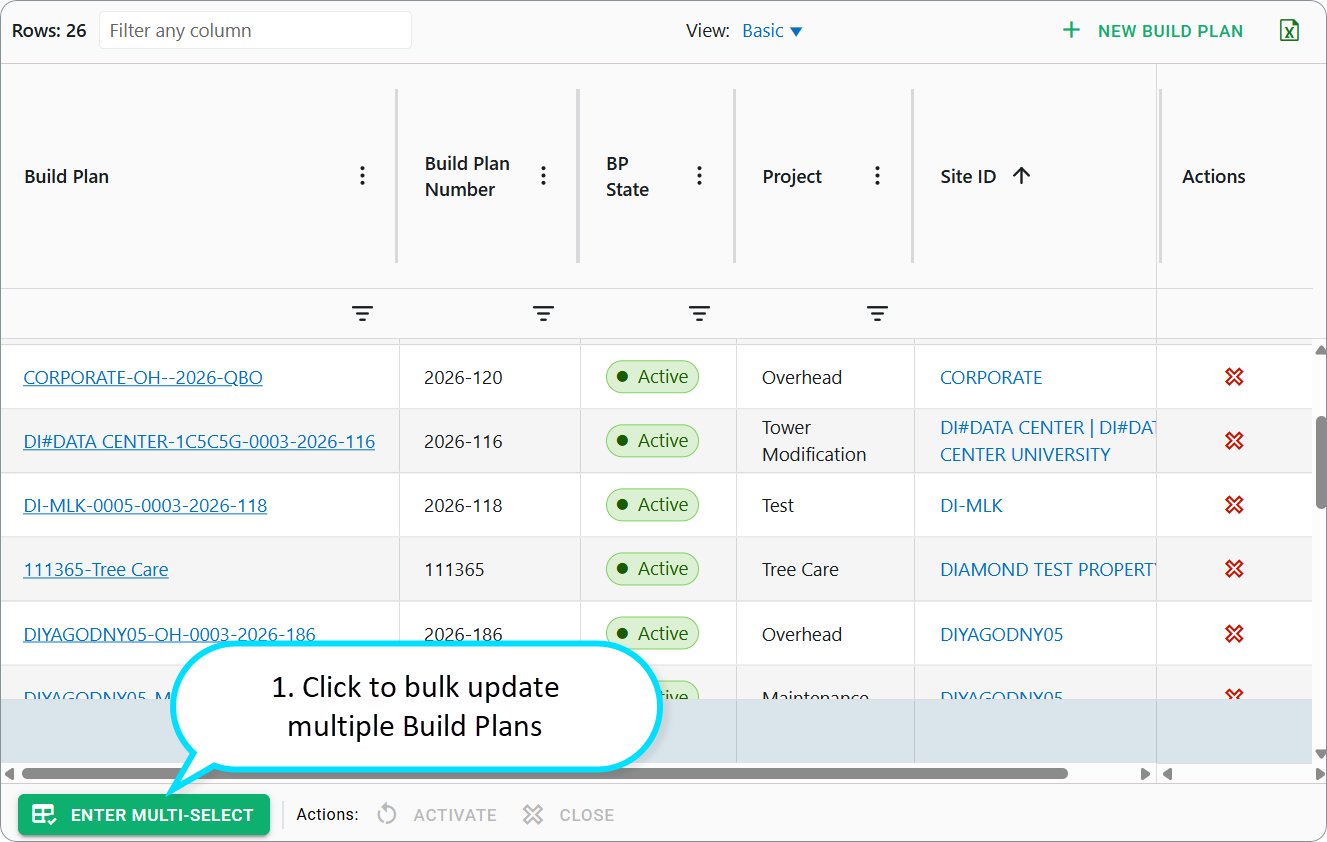
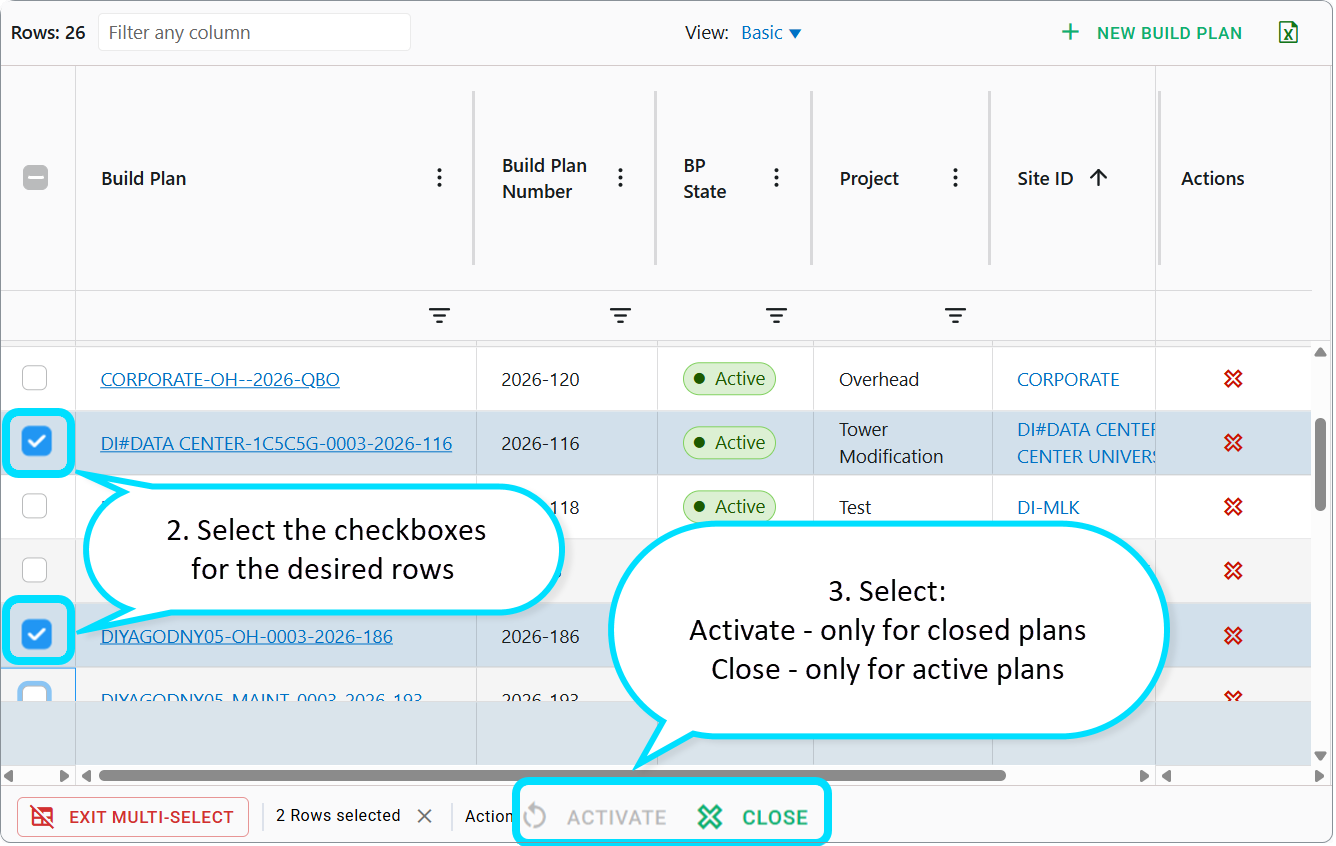
To update multiple plans simultaneously, click Enter Multi-select, select the checkboxes for the desired rows and use the Multi-Select Panel:
- Activate — only for closed plans
- Close — only for active plans
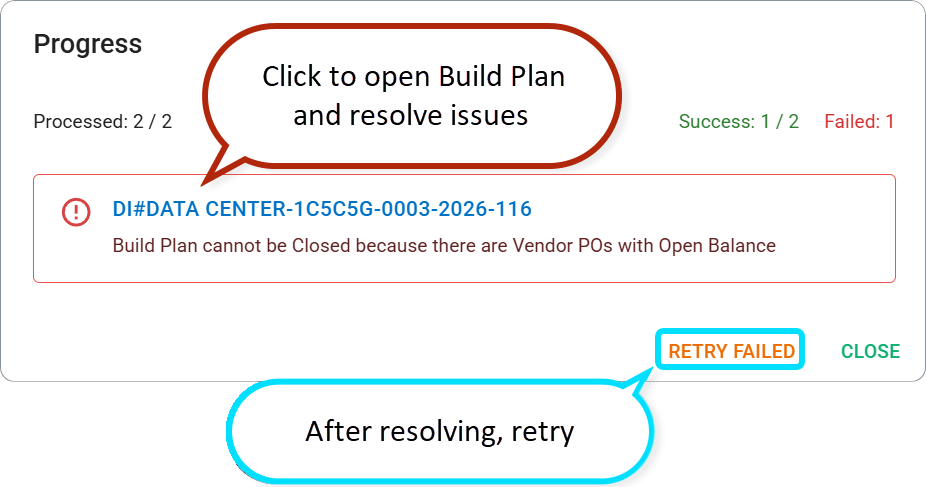
When you initiate a bulk operation, a progress dialog will appear. If any plans fail to update:
The dialog will display the specific error message for each failure. Read why you cannot close a Build Plan in the following article.
The Build Plan name will appear as a clickable link, allowing you to quickly open its details card and resolve the issue.
Creating Build Plan, Exporting, and Reloading
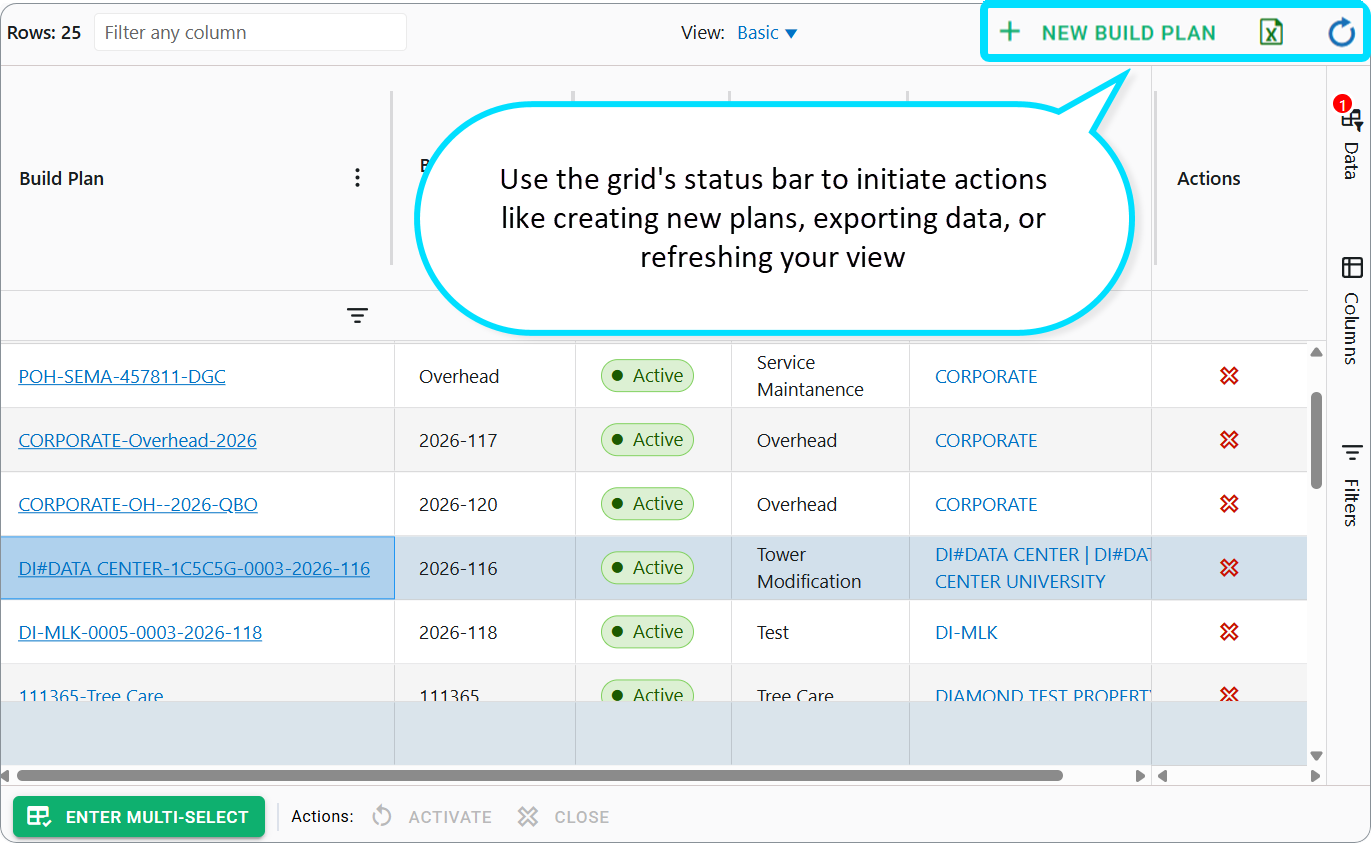
Use the grid's status bar to initiate global actions like creating new plans, exporting data, or refreshing your view.
| Action | Where to Find It | Who Can Perform It / What It Does |
| NEW BUILD PLAN | Status bar | Users assigned to the Can Generate BP employee role. |
| Export | Status bar | All Users. Downloads the current grid data as an Excel export, complete with clean dashboard formatting. |
| Reload | Status bar | All Users. Re-fetches fresh data from the server while completely preserving your current Refine Results filters. |
Dashboard Workflows
Track construction milestones
Switch to Milestones view → edit projected/actual dates inline → filter active BPs in grid.
Financial review
Set Show WIP Data on to month-end → open Cashflow and WIP Adj P&L → sort/filter on remaining cashflow or WIP.
Owner accountability
Open Owner Stats (pivot) → see counts of exception indicators per owner.
Find one Build Plan quickly
Use quick filter or column filter on name/number → click to open card.
FAQ
Who can open the Build Plans dashboard?
Any user in the All Users group can open the dashboard. Access to specific Build Plans depends on your relationship to the plan, such as owner, project role, or assigned employee.
How do I show closed Build Plans?
Open Refine Results in the Data panel, set BP State to Closed or All, and click Apply.
How do I review financial information?
You must first have the Financial role. After that, your Build Plan relationship and financial access rights determine which financial columns you can see.
Why are some values highlighted in red?
Red styling marks risk or exception conditions, such as overdue activity, over-budget amounts, kitted quantities above total BOM, or delayed financial milestones.
How do I export the grid data?
Use the Export control in the status bar to export the current view. If you need a specific server filter applied, set Refine Results first and then export.
Can I save a custom grid view?
Yes. Use Save Views to store filters, column layout, grouping, and pivot settings for quick recall.
Was this article helpful?
That’s Great!
Thank you for your feedback
Sorry! We couldn't be helpful
Thank you for your feedback
Feedback sent
We appreciate your effort and will try to fix the article